Have you ever used the map overlay report in Google Analytics?
It’s a fairly straight forward report that provides site metrics broken down by geographic region.
When viewing data for the United States, you get a row of data for each state.
Most of the metrics provide useful information if the visitor’s state has any significance to your business.
For example, visitors from Ohio might have a significantly lower conversion rate than other states, prompting you to adjust you online campaigns accordingly.
There is one metric though that’s alway’s annoyed me.
That metric is Visits.
The Visits metric simply tells you the number of visits to your site, and in our case, the number of visits from a specific state.
The problem is that in it’s raw form, this number doesn’t really provide any value.
Looking at a site that is evenly popular throughout the United States, you’ll usually see these states as the top four:
- California
- Texas
- New York
- Florida
Guess what? These states are the states with the largest population.
What I really want to see is how popular a site is per state, factoring in the actual state population.
Lets call this metric State Popularity.
In the past I simply downloaded the visits per state data into an excel spreadsheet and divided the number of visits by the state population. Crude, but it works.
I was discussing this with Jeremy Aube who wrote the fantastic Google Analytics Report Enhancer (or G.A.R.E) plugin for FireFox. I asked him if he could add State Popularity functionality to GARE and a few days later he did it!
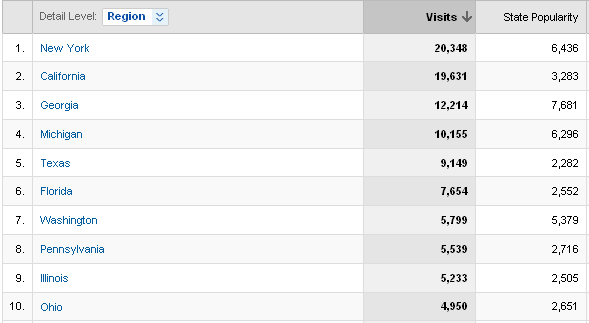
Here’s what it the report looks like with the new version of the GARE plugin:

The stats above are for a site that provides reviews and cheats for video games.
Looking at California (#2) and Washington (#7) it becomes obvious that although the site has almost three times more visitors from California than from Washington, I would guess that Washington has more gamers per-capita than California.
You can download the latest version of GARE from here:
Download the latest version of GARE
Jeremy should have more details about the technical side of things on his blog shortly.
Update:
Jeremy just posted a blog entry with the details of his implementation on the ROI Revolution Blog
http://www.roirevolution.com/blog/2010/02/state_popularity_the_latest_addition_to_the_gare.html
Enjoy and big thanks to Jeremy!
– Ophir
February 22, 2010 at 4:06 am
Nice hack – One question, shouldn’t the second column be a ratio or percentage i.e. “penetration” or “index”?
Also, to extend this, have you considered doing this on a per country basis for us non-US folks? World stats (internet penetration is probably best) are available from: http://www.internetworldstats.com/
Great idea guys 🙂
Best regards, Brian
Author, Advanced Web Metrics with Google Analytics
February 22, 2010 at 9:47 am
@Brian
We were indeed debating between using absolute numbers and a ratio/index type number.
Personally, I think the absolute numbers are more helpful and somewhat more intuitive since they preserve the context of the total number of visitors during a time period.
I was concerned that showing an index would be to abstract for some people. For example:
Ohio has a state index of 1.4323
California has a state index of 0.97312
Some people would then ask: What does that mean?
I like to think of State Popularity as this:
If every state had the same population (in numbers) how many visits would we get?
Regarding doing this for non US countries:
Technically, the framework is in place, so I’m guessing it should be very difficult – but Jeremy would be the person to ask.
You should comment on his blog posting about it:
http://www.roirevolution.com/blog/2010/02/state_popularity_the_latest_addition_to_the_gare.html
– Ophir
May 1, 2010 at 2:18 pm
Hi Ophir:
Great new metric. If only I could get it to show up! I am not a technical person, so please don’t reply as if I were an engineer/coder. I have downloaded both GreaseMonkey and GARE and my GA regional reports remain unchanged. How do I get GARE to take effect? Step-by-step instructions would be great. Thanks much!